BUILD
BUILD connects the list of metabolites together based on the following relationships: biochemical reaction, enzyme catalysis, encoding gene and metabolic pathway
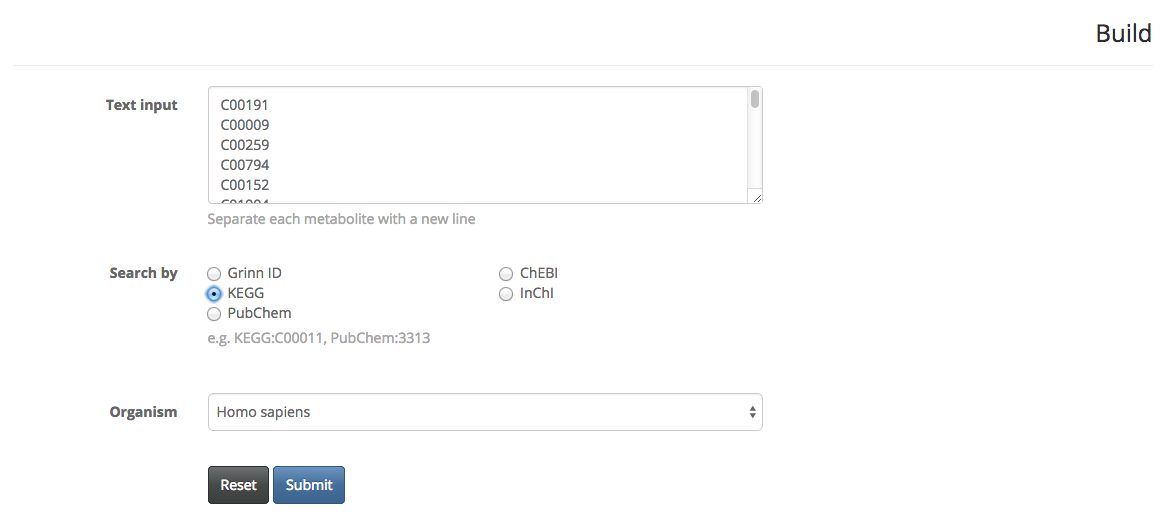
1) BUILD a network of 102 known metabolites resulting from the metabolomic profiles of psoriatic disease. See the original paper from April et al. (2014). In this example, KEGG ID is used as the input.
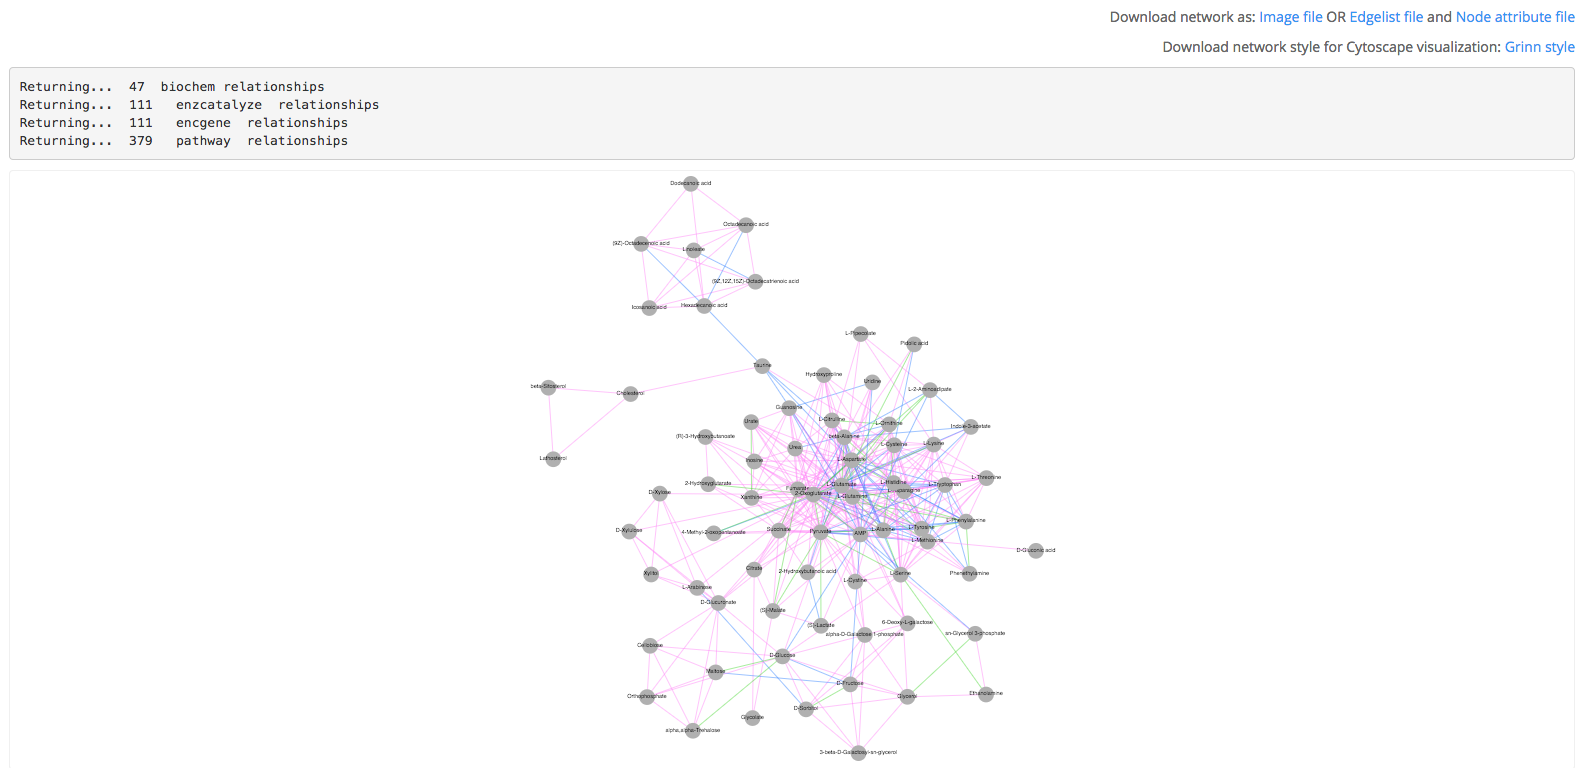
2) An interactive network is returned. The vertices are metabolites which are connected based on the following relationships: biochemical reaction (green), enzyme catalysis (blue), encoding gene (yellow) and metabolic pathway (pink). Download the network as an image or tab-delimited files compatible with Cytoscape visualization software. The tab-delimited files contain the list of edges and node attributes. Grinn network style is provided as an xml file which can be used directly in Cytoscape. Once downloaded, the network style can be reused.
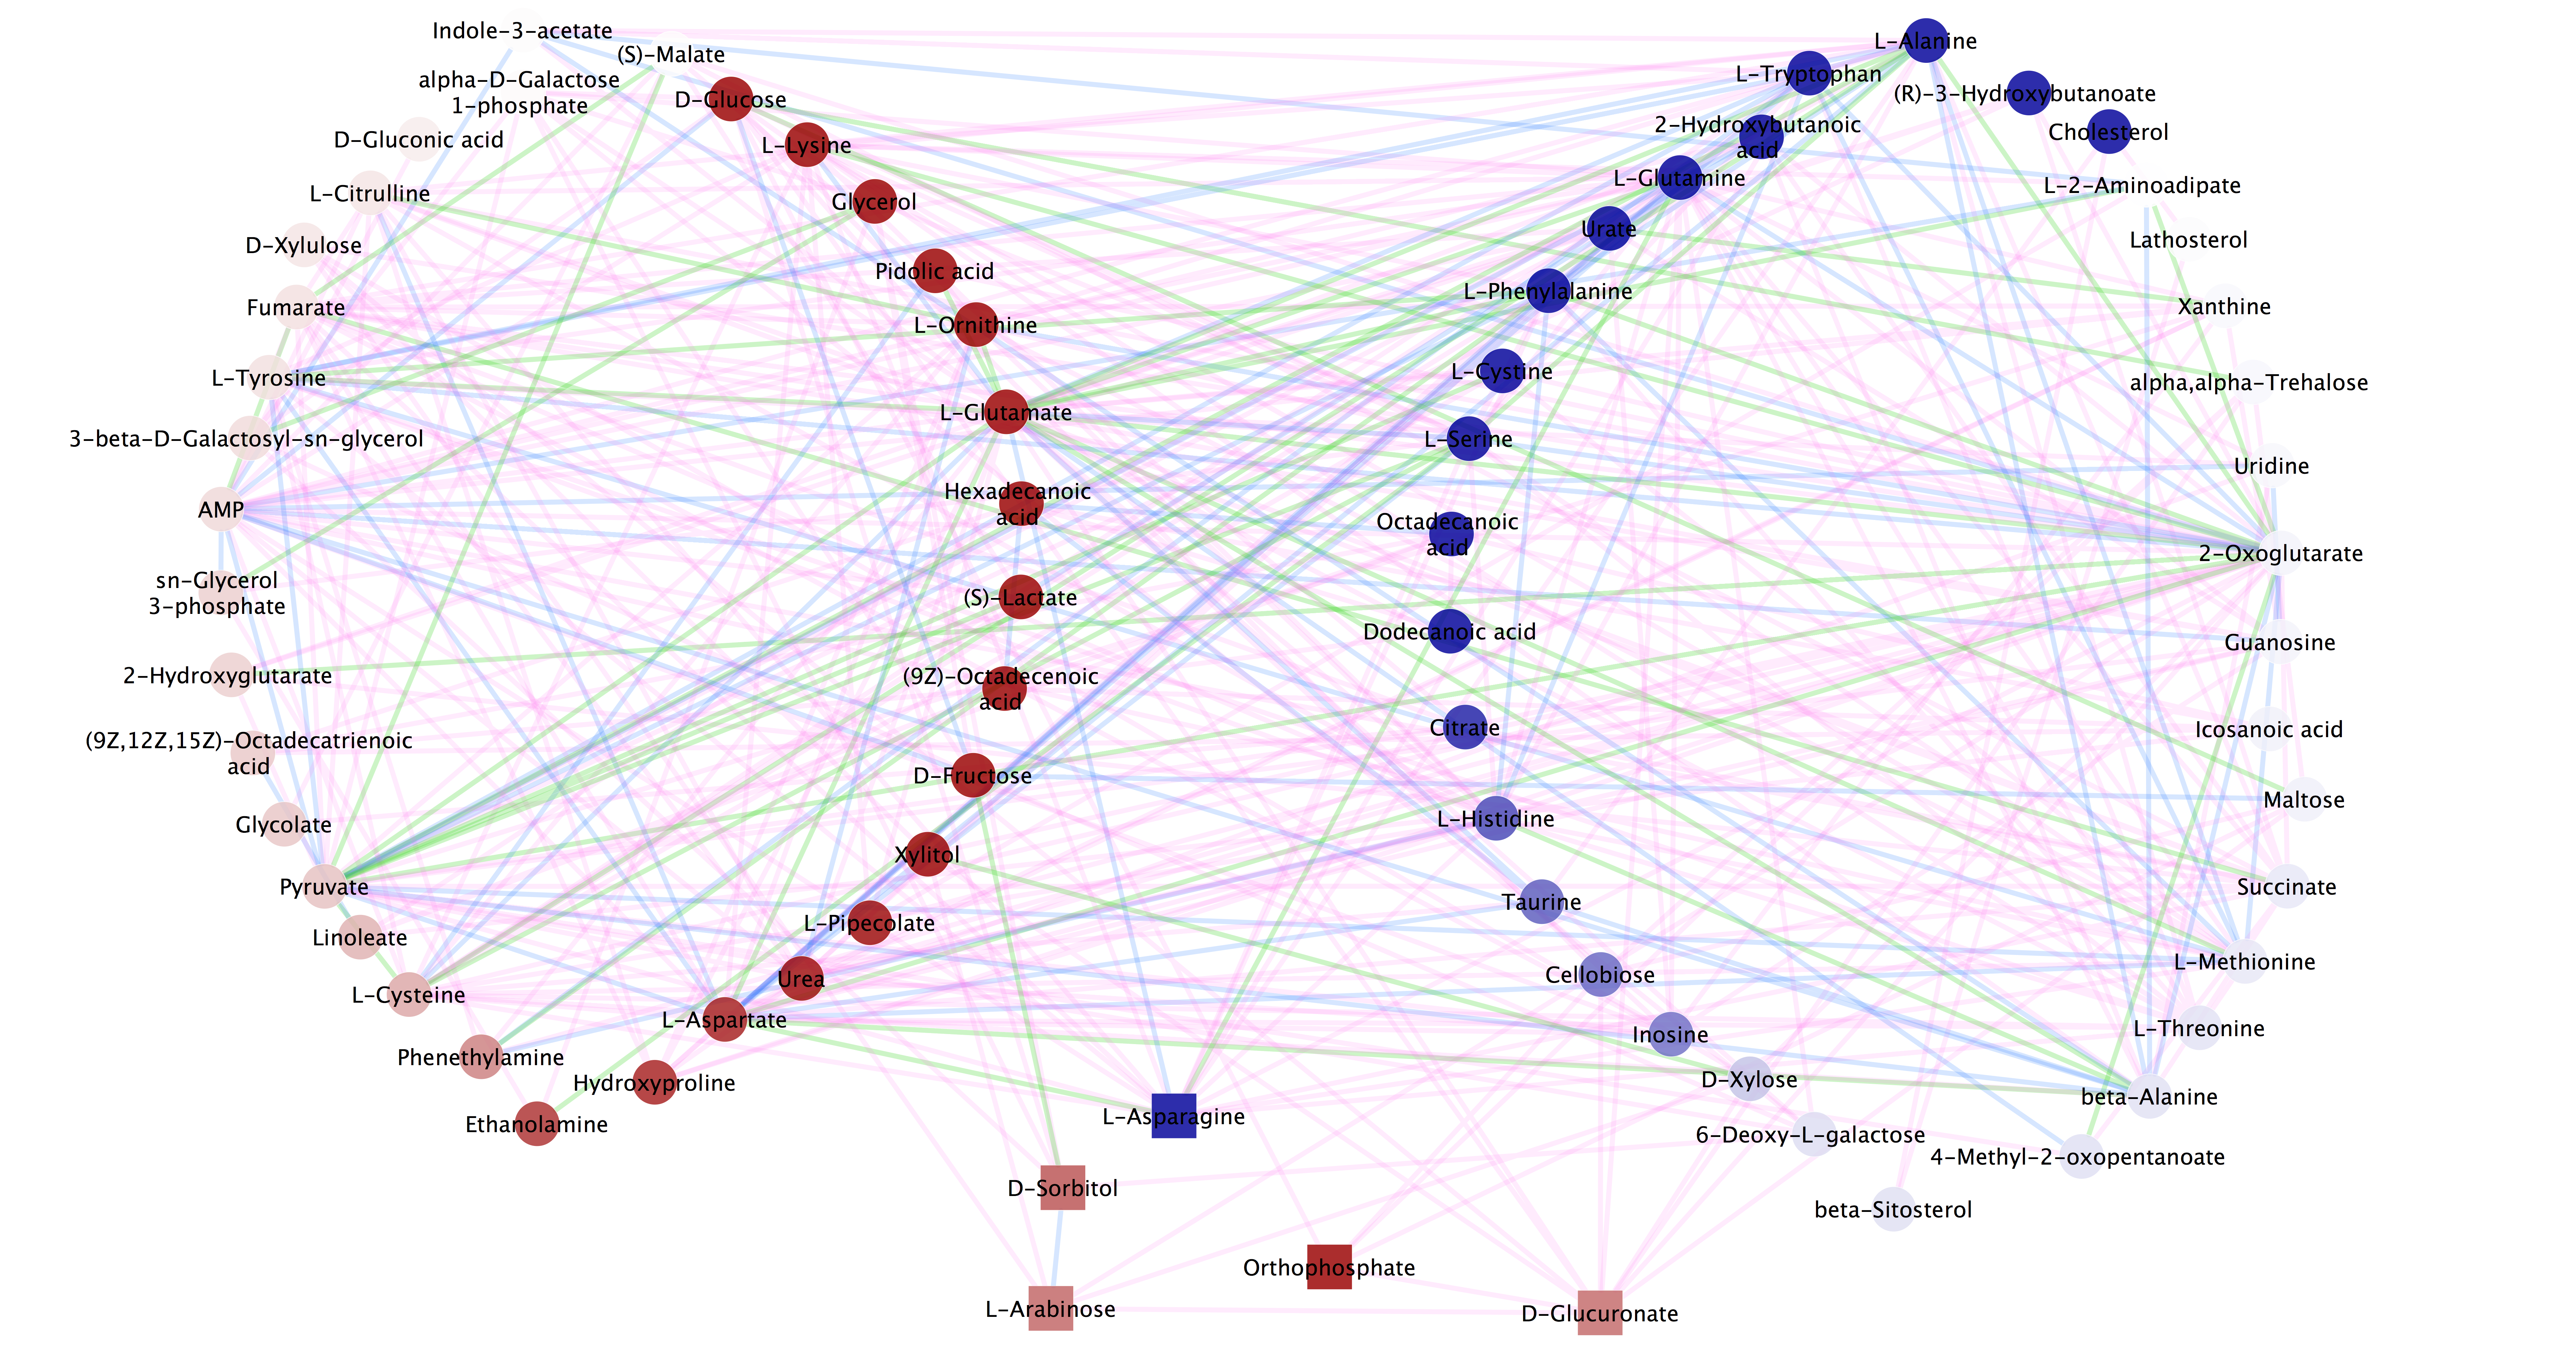
3) This figure is generated by Cytoscape. The network is mapped with statistical results from comparing the metabolomic profiles of psoriatic arthritis and healthy controls. The color-scale is based on the direction of changes: increase (red) and decrease (blue). The square nodes are statistically significant metabolites (p-value < 0.05). The edge color represents the type of relationships: biochemical reaction (green), enzyme catalysis (blue), encoding gene (yellow) and metabolic pathway (pink).
References
Metabolomics data used in this example are taken from the following publication:
- April W, et al. Metabolomics in psoriatic disease: pilot study reveals metabolite differences in psoriasis and psoriatic arthritis. F1000Res. 2014;3:248.